Follow the Vendée Globe 2024 from a GIS#
What is the Vendée Globe?#
Before we start talking about GIS and technical aspects, let's talk about the Vendée Globe.
It is a solo sailing race, non-stop and without assistance, around the world. It has been held every 4 years since 1989. The start is in Les Sables d'Olonne. The course consists of going down the Atlantic, then passing successively under Africa and the Cape of Good Hope, under Australia and Cape Leeuwin and finally under South America and Cape Horn, to return to Vendée as quickly as possible. The record was set by Armel Le Cléac'h during the 2016-2017 edition with a journey of 74 days 3 hours and 35 minutes.
Follow the progress#
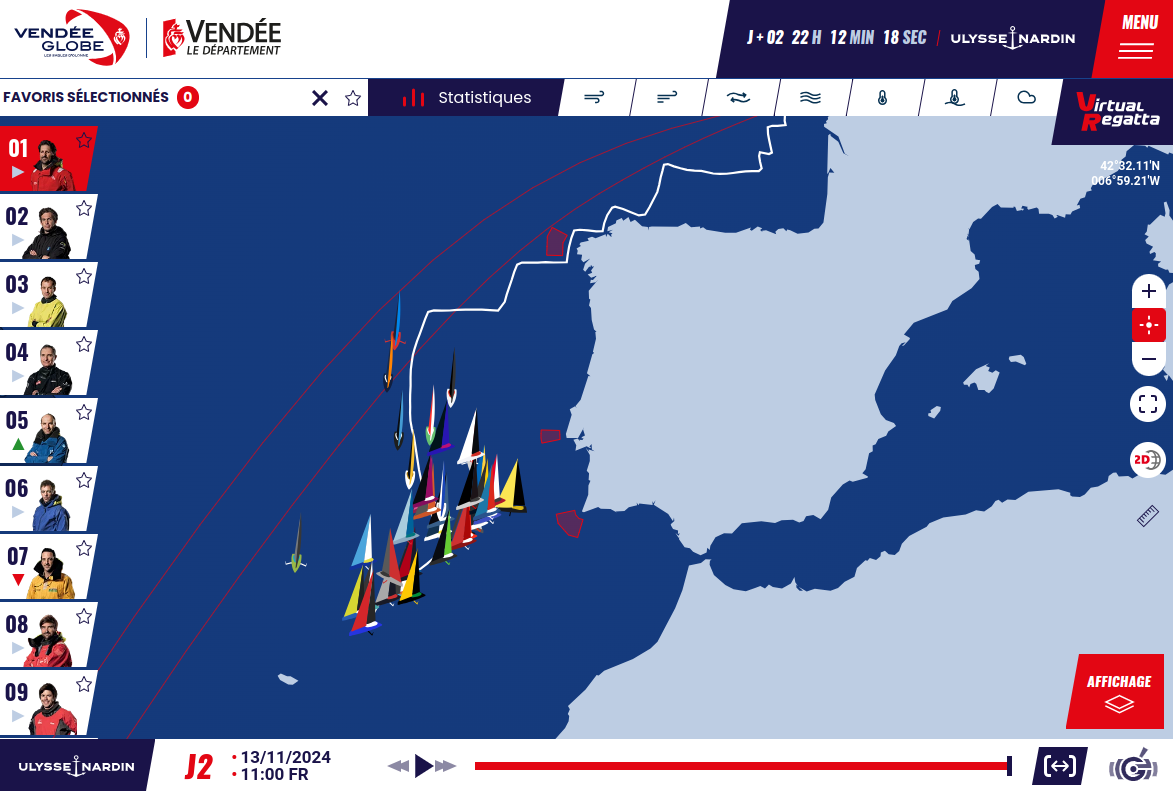
Who says race around the world, necessarily says map to follow the progress of the participants. The official website of the event offers an interactive map to visualize this progress.
So I looked to see if there was an API or web service providing the positioning data to visualize them in a GIS, like QGIS for example. After some research, I found nothing like that.
I found a discussion on Reddit about this, but without a conclusive answer.
On the other hand, I ended up discovering that the official website publishes every 4 hours an Excel file containing the navigation data and the coordinates of the boats.
This file communicates the positions every day at 2am, 6am, 10am, 2pm, 6pm and 10pm, with a delay of 1 hour. For example, the 10am file is provided at 11am (this is an element that will be taken into account in the industrialization of the process). To download this file, go to the ranking section.
This table contains the rank, the name of the boat and the skipper, but also the speed and course over the last 30 minutes, the last 24 hours and since the last score.
From this spreadsheet, the goal will therefore be to build geographic data for the race, whether to trace the trajectory, but also to aggregate all the scores.
Steps to follow#
You must start by retrieving the information relating to the positions of the boats. This means downloading the Excel files, because the site does not allow you to retrieve them in bulk. So I studied the structure of the URL to understand how they were generated and thus be able to reconstruct these download links.
https://www.vendeeglobe.org/sites/default/files/ranking/vendeeglobe_leaderboard_YYYYMMDD_HHMMSS.xlsx
It is therefore necessary to complete the date (YYYYMMDD format) and the time of the score (HHMMSS) to construct the download URL.
Then, it is necessary to deal with the way in which the location data is presented. Indeed, the positions of the boats are often provided in a geographic coordinate format in degrees, minutes and seconds (DMS). Although this format is useful, it is not directly compatible with geomatics tools. It is therefore essential to convert them into decimal degrees, a more standard and precise format, which allows easy working with maps and geographic information systems (GIS).
Finally, it is important to export this GIS data in a compatible format, such as GeoPackage or GeoJSON. Once converted, this data can be used in any GIS, whether it is a desktop GIS like QGIS or a web GIS map with tools like MapLibre or Leaflet.
Industrialize the method#
To automate the process described above, I created a GitHub project that automates these tasks with Python scripts. It works in command lines, and there are currently two of them (see below).
For downloading, I use the third-party library requests.
For reading the spreadsheet, cleaning the data and creating geometry, I use pandas, geopandas and shapely. There is some data cleaning to do, because the cells contain line breaks.
To go into more technical detail, once the file is downloaded, the successive steps are:
-
Opening the file in a dataframe, keeping only the columns and rows that interest us.
This involves loading the Excel file and extracting it into a dataframe, keeping only the relevant data for further processing, while ignoring the superfluous information. -
Creating headers.
The headers of the Excel file are often made up of merged cells, which makes them difficult to retrieve. In addition, the column names are sometimes too verbose, so they need to be simplified to make them more usable. -
Data cleaning.
This step involves removing line breaks, special characters, or any other anomalies that could disrupt data processing.DataFrame before cleaningrang code nom heure ... 24h_vmg 24h_distance dtf dtl 0 1 GBR\r\nFRA 100 Sam Goodchild\r\nVULNERABLE 10:30 FR\r\n ... 10.5 kts 255.1 nm 22300.7 nm 0.0 nm 1 2 FRA\r\nFRA 112 Sébastien Simon\r\nGroupe Dubreuil 10:30 FR\r\n ... 7.4 kts 223.1 nm 22324.7 nm 24.0 nm 2 3 FRA\r\nFRA 59 Thomas Ruyant\r\nVULNERABLE 10:30 FR\r\n ... 10.7 kts 288.1 nm 22352.7 nm 52.0 nm 3 4 FRA\r\nFRA85 Nicolas Lunven\r\nHOLCIM - PRB 10:30 FR\r\n ... 12.7 kts 306.4 nm 22378.5 nm 77.8 nm 4 5 FRA\r\nFRA 29 Jean Le Cam\r\nTout commence en Finistère - Ar... 10:30 FR\r\n ... 5.0 kts 158.5 nm 22379.0 nm 78.3 nm 5 6 FRA\r\nFRA 15 Clarisse Crémer\r\nL'Occitane en Provence 10:30 FR\r\n ... 7.3 kts 211.9 nm 22410.7 nm 110.1 nmDataFrame after cleaningrang code nom heure ... 24h_vmg 24h_distance dtf dtl 0 1 GBR - FRA 100 Sam Goodchild - VULNERABLE 10:30 FR - ... 10.5 kts 255.1 nm 22300.7 nm 0.0 nm 1 2 FRA - FRA 112 Sébastien Simon - Groupe Dubreuil 10:30 FR - ... 7.4 kts 223.1 nm 22324.7 nm 24.0 nm 2 3 FRA - FRA 59 Thomas Ruyant - VULNERABLE 10:30 FR - ... 10.7 kts 288.1 nm 22352.7 nm 52.0 nm 3 4 FRA - FRA85 Nicolas Lunven - HOLCIM - PRB 10:30 FR - ... 12.7 kts 306.4 nm 22378.5 nm 77.8 nm 4 5 FRA - FRA 29 Jean Le Cam - Tout commence en Finistère - Arm... 10:30 FR - ... 5.0 kts 158.5 nm 22379.0 nm 78.3 nm 5 6 FRA - FRA 15 Clarisse Crémer - L'Occitane en Provence 10:30 FR - ... 7.3 kts 211.9 nm 22410.7 nm 110.1 nm -
Creating the timestamp. A timestamp must be generated for each pointing in order to track the evolution of the position of the boats over time. It will also be useful for building the trajectory.
-
Converting latitude and longitude columns from DMS degrees to decimal degrees. First, you need to parse the coordinates to get the degrees, minutes, seconds and orientation. Then do the conversion.
-
Geometry creation. From the converted coordinates, you need to generate geometries. This consists of generating points for the positions of the boats (when plotting) or lines to draw the trajectories.
Converting DMS latitude/longitude to decimal then creating the geometry columnlatitude longitude latitude_decimal longitude_decimal geometry 0 17°56.15'N 31°09.06'W 17.937500 -31.151667 POINT (-31.15167 17.9375) 1 18°32.68'N 30°10.63'W 18.552222 -30.184167 POINT (-30.18417 18.55222) 2 18°19.45'N 33°17.34'W 18.329167 -33.292778 POINT (-33.29278 18.32917) 3 18°59.38'N 32°23.11'W 18.993889 -32.386389 POINT (-32.38639 18.99389) 4 19°17.37'N 19°24.52'W 19.293611 -19.414444 POINT (-19.41444 19.29361) 5 19°58.12'N 30°22.88'W 19.970000 -30.391111 POINT (-30.39111 19.97) -
Export to vector GIS format.
Export to Geopackage format.
For now, this project offers two features:
Get last point#
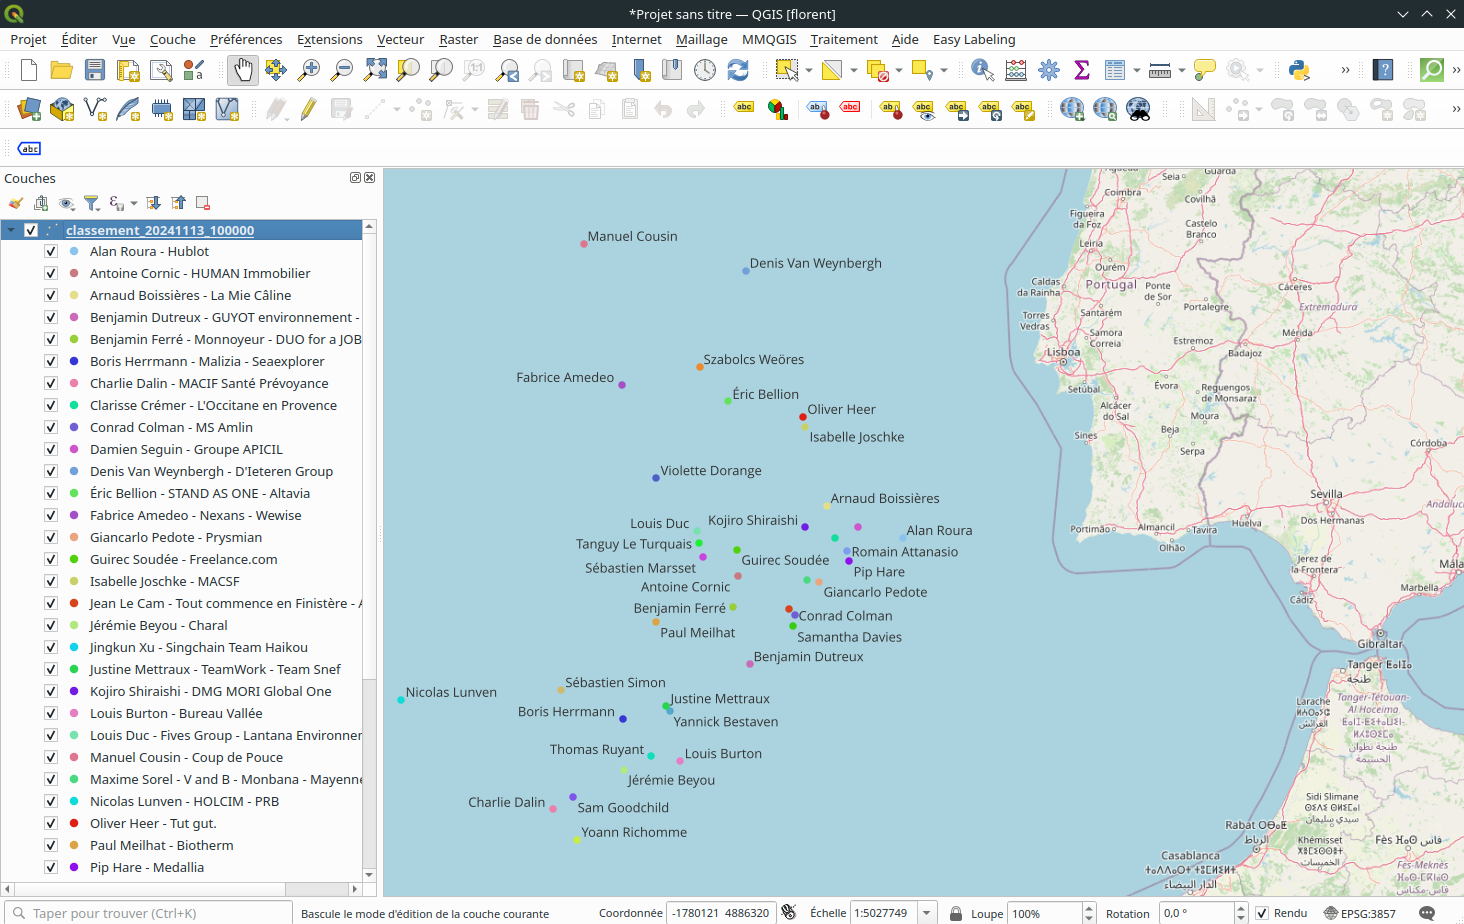
It This is a layer of points indicating the last communicated position of the competitors. The resulting format is a geopackage.
The result obtained is a layer of points of the latest pointing date. For example, if I run this command line at 2:45 p.m., I will have the 10 a.m. time stamp (and not the 2 p.m. one because of the 1-hour publication delay).
Once displayed in QGIS and with a little work on the style, here is the result:
Get all the scores and the track from the start#
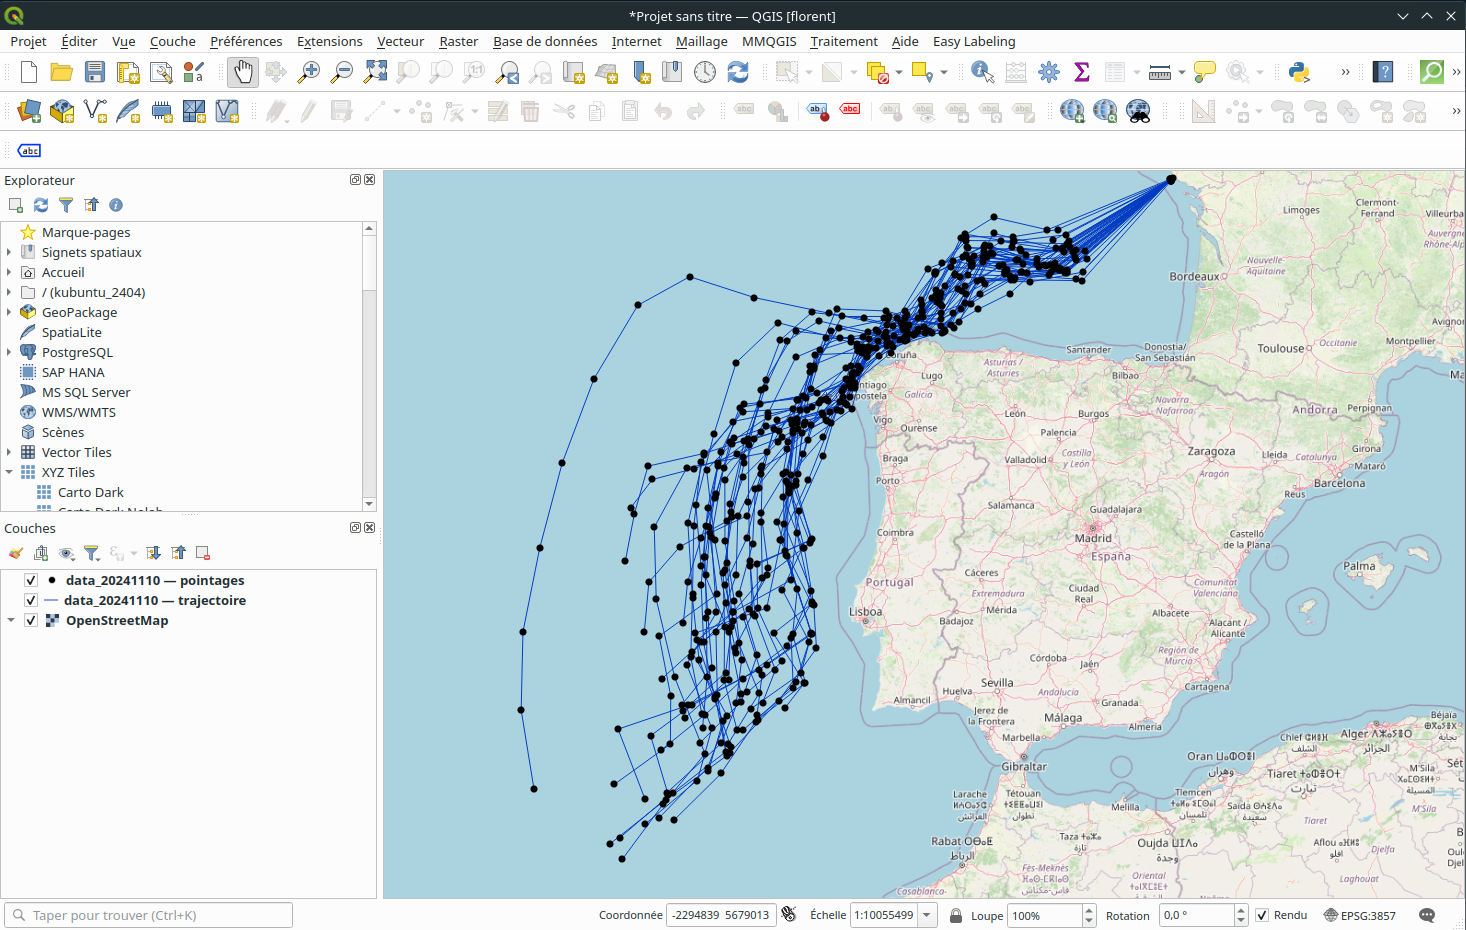
This is a layer of points indicating all the scores of each boat from the start, as well as a layer of lines connecting these points to form the trajectory of the boats. The resulting format is also a GeoPackage.
python trajectoires_pointages.py --output-dir ./data_vg
We obtain a geopackage which contains two layers:
- A layer of the history of all the pointings since the start.
- A line layer that reproduces the trajectory of each boat.
Attribute data#
In both features, we find in the attribute table of the layers all the information of the spreadsheet. I only added a timestamp column, it is used to link the points together and create the trajectory layer.
Meaning of prefixes in column names
30m= Since 30 minuteslast_rank= Since the previous point24h= Since 24h
Maybe we should remove the units in the data to have numerical values? In this case, we should perhaps add the units in the column names. This is one of the avenues for improvement. I would also like to separate the skipper's name and the boat's name into two separate columns. Contributions to improve this code are welcome.
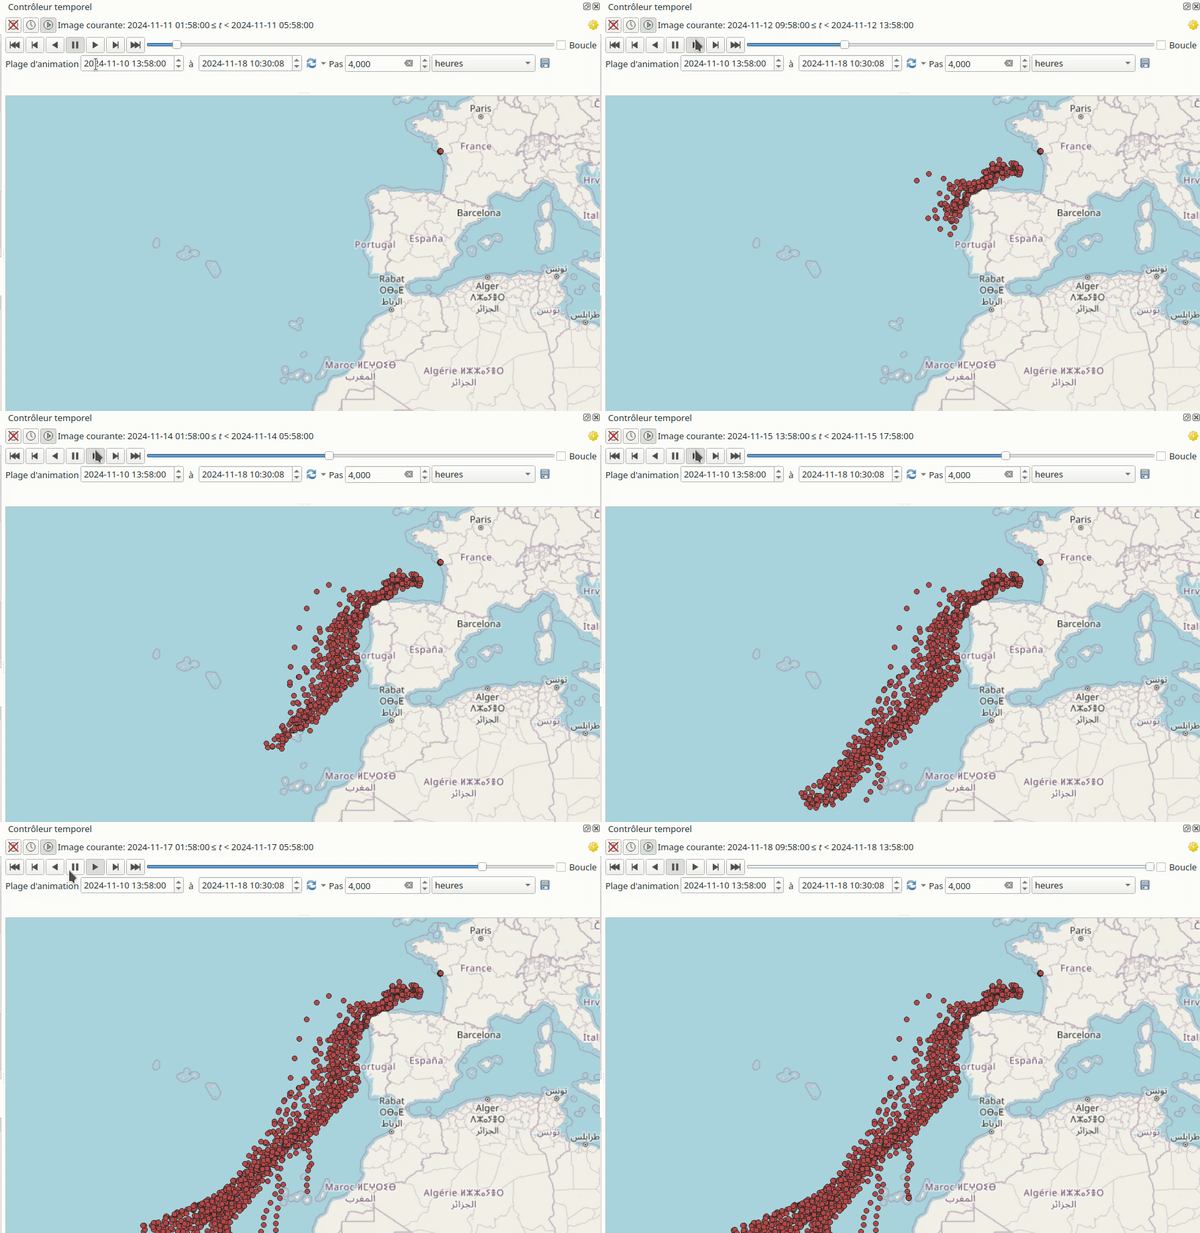
Animate the progression with QGIS's Temporal Control#
To visualize the data, QGIS is ideal and since the data has a temporal dimension, it is an opportunity to play with the temporal controller.
For this tutorial, you must use the pointages layer produced by trajectoires_pointages.py.
Configure the layer#
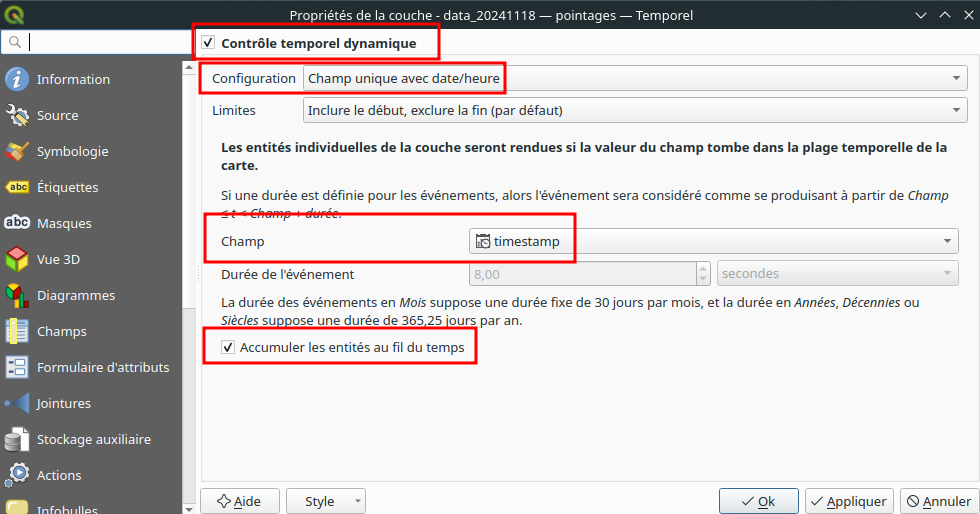
After accessing the layer properties (right-click > Properties), go to the Temporal tab. Configure the settings as follows:
Show the temporal toolbar#
- Right-click at the top of the toolbars.
- Check (if not already done) Temporal controller panel in the Panels section.
Configure the toolbar#
- Adjust the start date at the start of the event.
- Indicate a step of 4 hours (this is the delta between two points).
Layer animation#
After clicking Play, here is the result you should get:
To go further#
This first step is only a POC (Proof of Concept) the code can still be optimized and I will continue to do so throughout the race (hoping that the formalism and publication times of the spreadsheet do not change). Subsequently, several ideas could be explored. I will surely explore one of them.
-
Create a QGIS plugin: A QGIS plugin could allow to load the ranking, the last position of the ships, and their trajectory. We could imagine that the post-processing of the Excel file to GIS data is done by continuous integration (CI) and exported in GeoJSON, and that the plugin loads these GeoJSON hosted in the GitHub project.
-
Provide data via an API: We could imagine a project that automatically retrieves this data, converts and structures it, then exposes an API that provides a position or trajectory based on a competitor's number, for example.
-
Create a cartographic web application to visualize the progress of the boats with more possibilities than what the official cartographic interface offers. I had imagined using mviewer for this.


